

Be aware: Google has introduced a new campaign type that has replaced Smart Shopping: Performance Max Campaign (PMax). All Smart Shopping Campaigns have been automatically migrated to PMax, fromJuly 2022.
Read more about Performance Max here, or download our whitepaper for more in-depth information.
The advertisement of product A does not lead to the purchase of product A
First, I will briefly go over the way in which SEA specialists view the results of their Google Shopping Campaigns. As a SEA specialist, you probably look mainly at the revenue resulting from advertisements. Most likely you will settle on an ROI or ROAS target.
Because you look at the turnover from orders, you probably never drill down to how the order came about and what has contributed to the order. This is still very important. That which you are advertising is not always what you are selling.
In many cases, more than SEA specialists and online marketers realize, the advertisement of product A does not lead to the purchase of product A. We are talking about more than 50% (!) of sales for some advertisers. Based on the product advertising contribution model, I explain why this observation and insights are of such great importance.
Google Shopping Campaigns & Product advertising contribution model
In the model below, you can immediately see that the advertisement for product A does not always lead to the purchase of (just) product A:
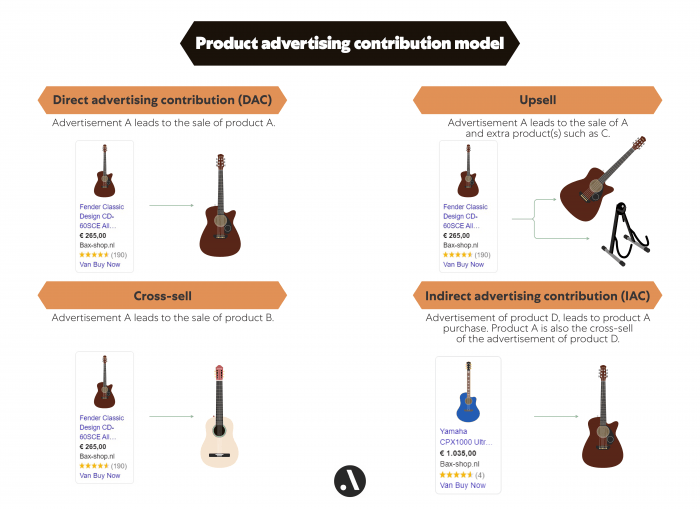
Explanation:
In the above collection, guitar A and D are well-known guitar brands. Guitar B, on the other hand, is a private label, but rather similar to guitars A and D.
Because it is likely that when someone buys product A, B or D, these products are often cross-sellers of each other. Product C is a guitar stand. This product is cheaper than A, B and D and is often purchased. It is therefore an upsell product.
If product A is used as a marketing content and only product A is purchased, we call this direct advertising contribution. If by advertising product A, product A and product C are purchased then product C falls under the upsell of product A.
If you reach product B through the marketing of product A and buy only product B, Then we are talking about cross-sell.
From a different angle: The number of times product A is purchased from the advertisement of product D, we refer to it as indirect advertising contribution. In this case, product A can also be called the cross-sell of the product D ad.
Margin and inventory: important cross and upsell insights
A critic will say: why are these insights interesting? After all, the conversion value that you see in Google Ads already incorporate the cross-sell conversion value, because if guitar B (144 euros) is bought by the advertisement of guitar A (265 euros), the conversion value in Google Ads is 144 euros. So, the cross-sell conversion value is already in Ads.
However, what is not included here are the margin and the impact of a product being (possibly) out of stock.
Why are these cross- and upsell insights such as margin and stock important?
The right products in stock
Suppose product A generates much cross-sells but of itself is not sold very much. If product A is no longer in stock – and therefore product A is no longer advertised – the cross-sell products of product A are likely to be sold less. It is therefore important that product A is kept in stock.
The right target at the right margin
Suppose product A has a low margin, but almost only cross-sell products with a large margin are sold through the product A advertisement. In that case you would want to adjust your ROAS target accordingly.
How does this work? I will explain based on the calculation example below, for which I will use the guitars once again:
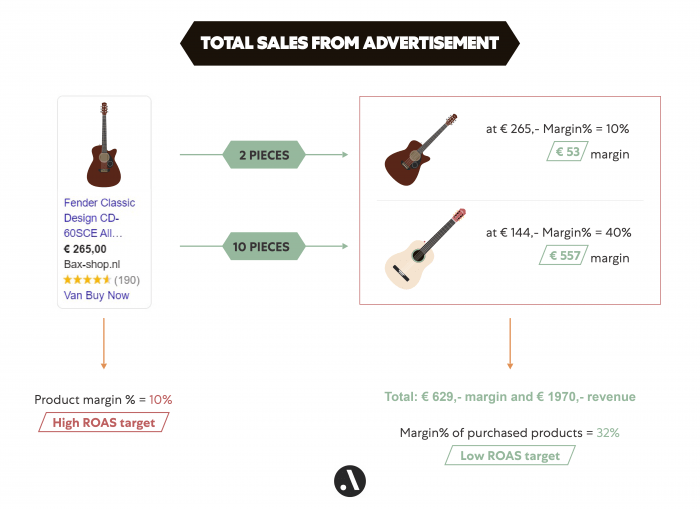
As you can see, the advertisement of guitar A often leads to guitar B sales which has a higher margin. If you “merely” assume that the advertisement of guitar A leads to the sale of guitar A, then you would set a high ROAS target for it, because the margin is small.
If you consider sales insights and know that the advertisement of guitar A often leads to the sale of guitar B, then you will see that a low ROAS target is actually much more appropriate.
The same goes, of course, for upsells, for which the margins differ a lot from the product being advertised. With the above cross and upsell insights, you can now reach the right targets.
It would be even smarter to work towards POAS target, by which you look not only at the (“misleading”) revenue, but at the total profitability of an advertisement.
Tip: Download the guide: From ROAS to POAS and learn how to implement Profit On Ad Spend step-by-step in your campaigns.
Hypothesis testing with specific categories/variables
Following the examples above: as a starting point, you could also test your own made category of products. For example, do you suspect that your advertisements of sneakers over 120 euros often lead to the purchase of a certain B-brand sneakers of around 80 euros? Or alternatively: might it be good to test this?
Size insights: link your stock to your size chart
If we look at the clothing industry – or other industries that sell products in multiple sizes – size insights are also interesting. People often do not look specifically for a product size but come to you for one of the sizes.
An overview of the sizes sold in the past, for example by product, by brand and/or by product type, we also call a size chart. If you link it to the current stock of a product, you come to an interesting insight: the weighted availability. It expresses as a percentage for how many buyers the matching size is in stock.
The size chart in combination with the weighted availability looks like this:
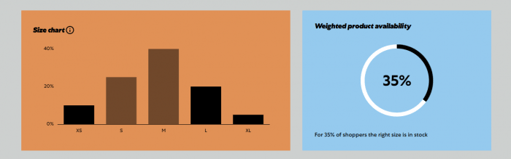
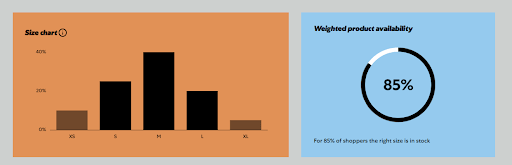
Notes:
Suppose that a company purchases sizes XS, S, M, L and XL from the clothing item above. In the past, size XS 10%, S 25%, M 40%, L 20% and XL 5% have been sold.
If sizes XS, L and XL are available, but sizes S and M are out of stock, sales performance is likely to decline. As you can see in the first image above, the weighted product availability will be only 35%, because of 65% of sales relates to a product in size S and M. If the sizes XS and XL are sold out, this has much less impact on sales performance.
Looking at the second example: if sizes XS and XL are in stock, this will have much less negative influence, because the weighted product availability will be 85%. The difference is therefore significantly large.
With insight into the weighted product availability, you can optimize the advertising correctly, for example just for the remaining sizes, and/or adjust your procurement.
Customize your offer or target with the right insights
Depending on which industry you operate in, the above insights can help you optimize your campaigns. By optimizing I mean adjusting your offer or target in advance and/or managing the procurement department better.
In any case, you need to be able to work well with data in order to be able to reach such insights. For small data sets you could do the above in Excel, but I prefer a program where you can process more data, like with a script in R or Python.
However, you can also easily display the above insights in PPC management software in a clear dashboard by product, category, brand or total.
Do you have any questions, comments, tips or tricks? Then I’d love to hear from you.
Tip: Download the guide: From ROAS to POAS and learn how to implement Profit On Ad Spend step-by-step in your campaigns.
This might also be interesting: tips for naming conventions for campaigns
